Introduction
I host about about a dozen (like eggs™) WordPress websites. Years ago I started with SliceHost, however in 2008 RackSpace acquired SliceHost and a year ago my VM was fully migrated. The migration went smoothly and transparently. At every step, I received an email notifications of data center transitions and finally an invitation to use the RackSpace control panel. Since then my websites have been hosted with RackSpace without any intervention from myself.
However recently with some extra time on my hands I decided to give into the buzz and try Amazon Web Services. It was especially tempting because with their free tier I could test out their RDS (MySQL) and Compute (EC2) services for free. I spent a month automating my infrastructure using Puppet and GIT, so on the migration day all I had to do was install puppet and the server would be built with all of the prerequisites and all of my WordPress sites and their relative database schema would be deployed from their GIT repositories. For small and mostly static WordPress sites, this was an ideal deploy scenario. I migrated and watched my sites response time with Pingdom. The page response time went up. How can it be? I moved from a 512MB instance with a MySQL server running locally to a 512MB instance with a dedicated MySQL (RDS) server.
I decided that before I perform another migration, I need to do some testing. I chose to test four providers Amazon, RackSpace, DigitalOcean and SoftLayer. All four offered comparable prices and some sort of a free tier. Feature-wise, RackSpace and SoftLayer seemed the most enterprise worthy. Both offering support, managed services, dedicated cloud and ability to mix cloud and bare metal resources. Amazon has a wide range of services but little in terms of flexibility and support.
For my operation, I didn't care about support or features outside of running a stable and well performing virtual server. As a matter a fact, my use case was even more narrow. I was hosting WordPress websites on a LAMP stack. I decided to test just that.
Experiment
Servers
| Name | Provider | CPU Clock | CPU Cache | CPU Bogomips | RAM | Price |
| baseline01.xeraweb.net | Baremetal with XCP* | 3.00GHz | 4MB | 6000 | 1GB | $40* |
| digitalocean01.xeraweb.net | DigitalOcean | 2.3GHz | 4MB | 4600 | 1GB | $10 |
| rackspace01.xeraweb.net | RackSpace | 2.6GHz | 20MB | 5200 | 1GB | $29.2 |
| amazon01.xeraweb.net | Amazon EC2 | 2.00GHz | 12MB | 4000 | 1.7GB | $43.8 |
| softlayer01.xeraweb.net | SoftLayer | 2.4GHz | 12MB | 4800 | 1GB | $50 |
*Hosted on an HP DL360 G6, spooling softly in my house. Power consumption (NYC Residential) 300 Watt, 40$ monthly, hardware not included.
Installation
Provisioning
All servers were spun up using the web interfaces of their providers. All servers were built with Ubuntu 12.04 LTS 64bit.
Automation
After that the latest version of puppet was installed. Notably this was a manual step, however each provider also offered an API that allowed this step to be automated. However because each of them uses a different API, I decided to spend a few minutes at the command prompt.
sudo -i
wget http://apt.puppetlabs.com/puppetlabs-release-precise.deb
dpkg -i puppetlabs-release-precise.deb
apt-get update
apt-get install puppet
Puppet Manifests
The puppet manifests were constructed to install a local MySQL instance, an instance of Apache with mod_php and a deploy of WordPress. The whole /etc/puppet directory of the Puppet master is available for download from the Puppet WordPress Benchmark GIT Repository. The commit number "a8e5abe6d17d6c51305488ced9307fa49edca3be" was used for this test.
Results
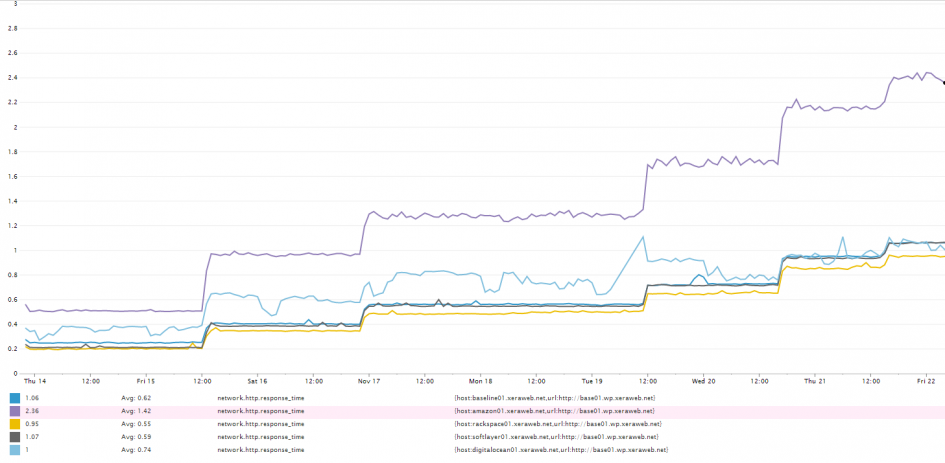
RackSpace and SoftLayer performance was the closest to the baseline and showed almost no neighbor noise despite the test lasting 8 days. DigitalOcean's performance varied erratically, and Amazon was plain sluggish in comparison with the others. The following graph shows the average response time as measured from the same server (bypassing any network overhead). Each step in the graph is an addition of a base installation of WordPress and an HTTP health check for that instance. Since all of the health-checks fire off simultaneously, the number of sites can equate to a number of simultaneous web requests per second and their average response times.
| Number of Websites |
Average Homepage Response Time by Provider (Seconds) | ||||
| Baseline | Rackspace | Amazon | Softlayer | DigitalOcean | |
| 1 | 0.25 | 0.20 | 0.51 | 0.21 | 0.37 |
| 2 | 0.40 | 0.35 | 0.96 | 0.39 | 0.57 |
| 3 | 0.56 | 0.49 | 1.28 | 0.55 | 0.76 |
| 4 | 0.73 | 0.65 | 1.71 | 0.71 | 0.84 |
| 5 | 0.97 | 0.85 | 2.15 | 0.94 | 0.95 |
| 6 | 1.06 | 0.95 | 2.41 | 1.06 | 1.06 |
Web Response Time Home Page Response Time by Cloud Computing Provider
Each step in the response time graph represents an addition of a WordPress instance and it's HTTP health check. This part of the test was done manually i.e. I amended the ordenull::benchmark class and executed puppet agent --test on all of the servers simultaneously. Within 5 minutes each of the servers had added another installation of WordPress.

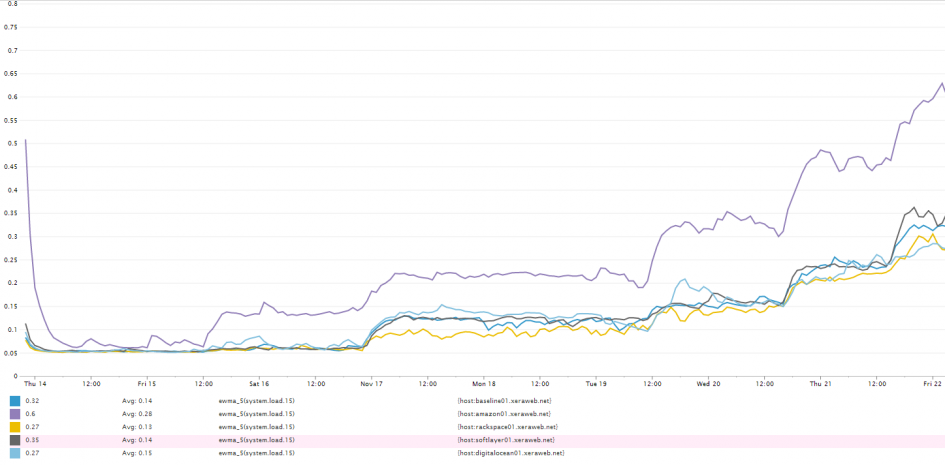
Server Load Exponentially Weighted Moving Average Chart of the 15-Minute Server Load Average

With 6 concurrent HTTP check requests every 15 seconds, the CPU load average is within healthy operating range. I wouldn't consider any of the servers to be overloaded by this test. This of course opens up another mystery. Why am I seeing such a difference in response times?
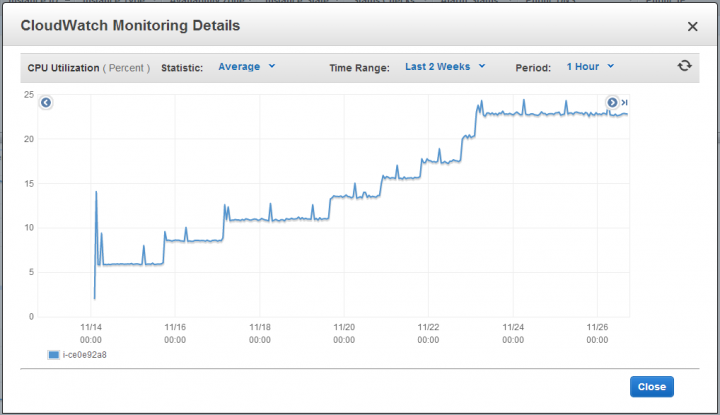
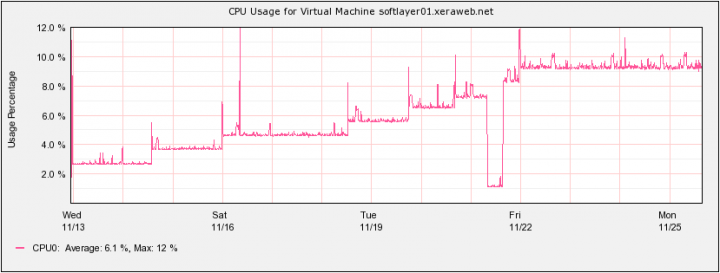
I thought I would check what metrics are seen from the virtual machine hosts as well. Luckily both Amazon and SoftLayer provided complimentary basic monitoring. These metrics covered CPU Utilization as viewed from the VM Host and a few others. I found the CPU utilization to be the most interesting because it has potential to show another side of the story not seen from inside of the virtual machine. Depending on how the hypervisor allocates it's resources the CPU utilization that's seen from the VM and from the hypervisor could differ (See EC2 Monitoring: The Case of Stolen CPU).
The graphs didn't reveal anything groundbreaking. Amazon's CPU usage has barely reached 25% and SoftLayer was at around 10%. I imagine that if I continued adding WordPress instances until I reached 100%, the differences in response times would fan out even more. Unfortunately I didn't have the patience nor the funds to do that this time around.
Disk IO Crude comparison of sequential reads and writes to persistent storage
After completing the WordPress response time test, I also performed a basic comparison of IO performance to measure sustained disk IO with 64kb block sizes totaling 1GB. The write test was done with dd if=/dev/zero of=/test bs=64k count=16000 and reads were measured with dd if=/test of=/dev/null bs=64k. I waited 20 minutes between the read and the write tests in hopes that any data cached on the hypervisor side (RAID controllers and SAN) would expire.
| Persistent Disk Operation |
Average Throughput of a 1GB Linear Transfer (MB/s) | ||||
| Baseline | Rackspace | Amazon | Softlayer | DigitalOcean | |
| Sequential Write | 213 | 195 | 34 | 181 | 541 |
| Sequential Read | 236 | 320 | 10 | 194 | 517 |
These results start to better explain the sluggish performance of the Amazon instance in comparison to the baseline. However after 8 days I would expect that the actively read PHP files and MySQL tables would have been cached in RAM by Ubuntu and free -m was showing around 300MB used for caching.
Conclusion
To make a fair comparison, I will divide the providers into two classes - 'Enterprise Worthy' and 'Developer Friendly'. Both RackSpace and SoftLayer's offering is similar and they both provide in-house managed services and support; I will classify them both as Enterprise Worthy. DigitalOcean reminds me of Slicehost. They only offer compute and DNS services but at a great bargain; I classify them as a Developer Friendly. Amazon is somewhere in between; Although they have a service great offering, they lack in-house managed services and their performance doesn't seem to be on par with other providers in this test.


Chris Anderson says:
Great article. I just signed up with DigitalOcean after having heard of it at the office “by the water cooler”.
I’ve been a happy Rackspace customer for years, but they hiked their prices 1-2 years back and retired their smallest VPS offering. For DevOps-kind of development I am really looking for the best possible price/performance. This article saves me from having to do the same kind of “due diligence”.
My takeaway is that DO is likely a good second VPS to leverage, especially during early development and prototyping phases. However I’ll retain my account at Rackspace and use DigitalOcean for pre-prod and production deployments. DO really is very convenient for developers, but Rackspace has been in the game a lot longer and have their infrastructure and organization more finely tuned to the business and enterprise needs. Their support is stellar, employees very competent and service minded. Couple that with the fact that the quality of their actual VPS implementation is fantastic and one starts to understand why you pay a bit of a premium for their services.
Amazon I never could get my head around, with its incredibly complex payment and service structure, relative hurdle to get up and running, and apparently sub-par performance (service quality). They do get my respect for basically having founded the IaaS notion and market, but they don’t seem to have progressed very far since they came up with the idea.
Softlayer and Rackspace put some well needed polish on the kind of offering that Amazon started, and the former two do seem to be *the* premium providers in the space. If DO caters for another audience, I think that’s fine. They should be able to do very well just targeting the pre-production audience.
April 18, 2014 at 9:06 pm